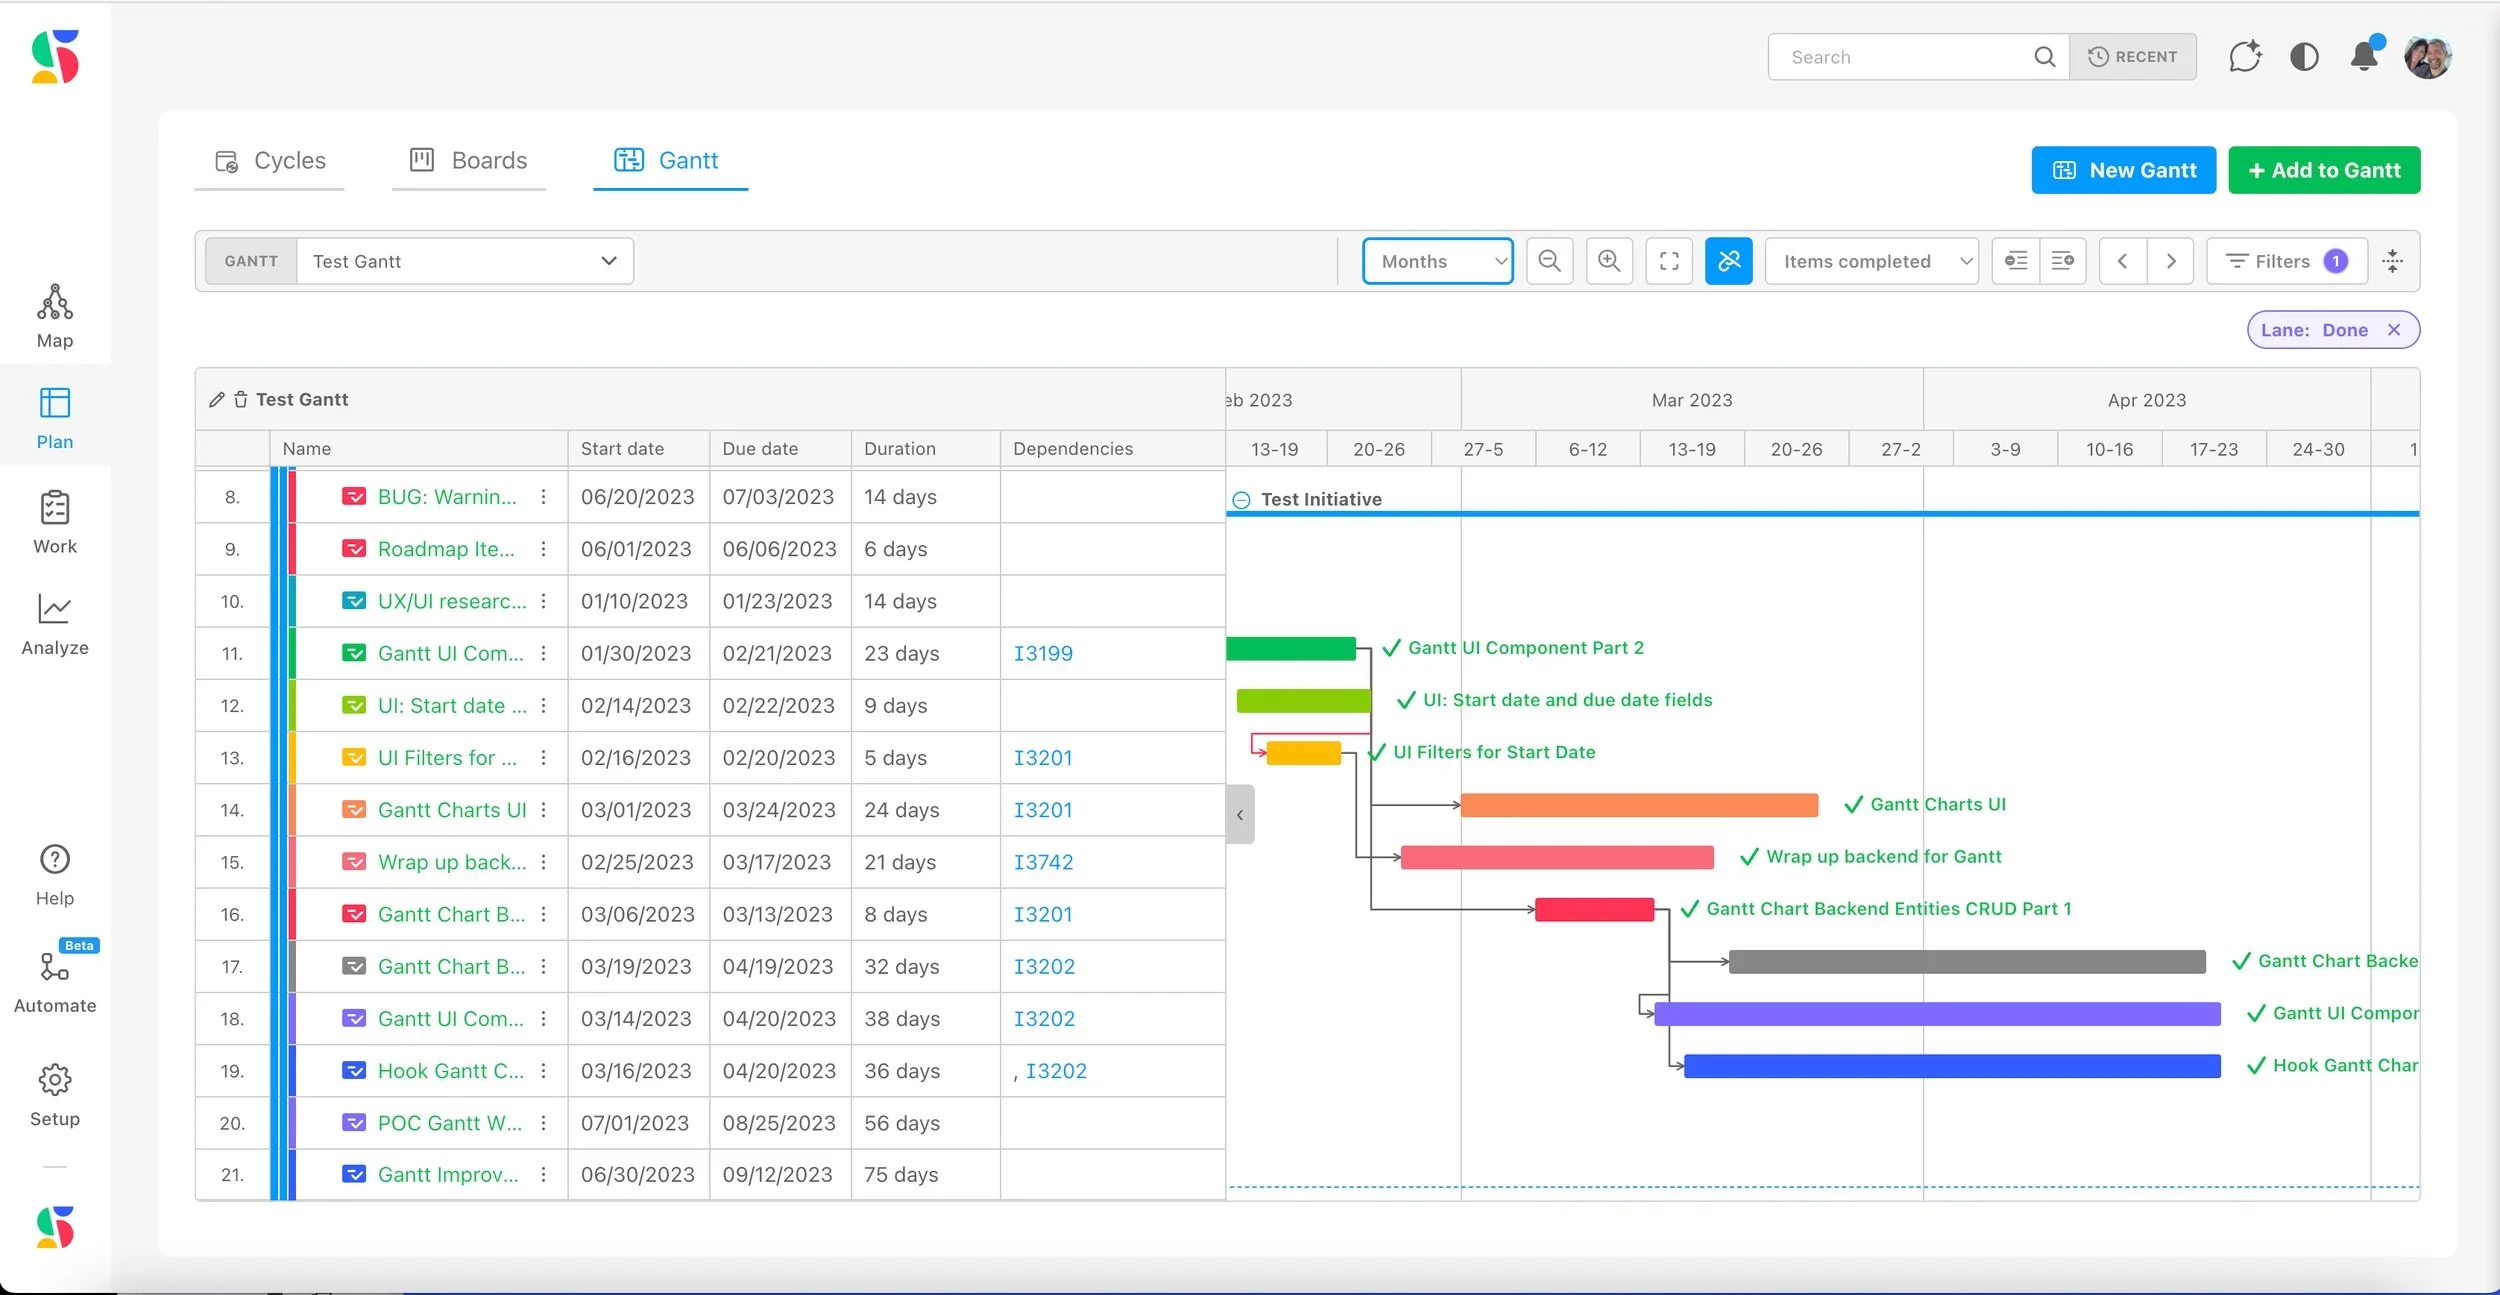
Gantt Charts
Experience the power of our versatile Gantt charts, meticulously designed to bring clarity and control to each of your initiatives.
Reducing delays is the fastest way to reduce time-to-market.
Most problems with your process will surface as delays. Most of the time spent getting to market results from these delays. Reducing delays is the fastest way to reduce time-to-market. DevStride offers a range of tools and features to help you maintain forward motion. By visualizing timelines and dependencies, enhancing team collaboration, and providing real-time tracking, DevStride enables quicker decision-making and more efficient project delivery, ultimately shortening your time-to-market.
Combat delays with DevStride
Visualize Timelines
Gain a clear understanding of project schedules and milestones with our visually captivating Gantt charts. Our charts provide a comprehensive timeline, allowing you to easily grasp task durations, start and end dates, and project progress.
Track Dependencies
Effortlessly manage task dependencies and ensure project success. Easily identify critical path activities and understand how changes to one task can impact the entire project timeline. Link tasks together to ensure smooth workflow coordination and facilitate informed decision-making.
Monitor Progress
Our Gantt charts visually represent the progress of completed, ongoing, and pending tasks in real time. As tasks are completed, the corresponding bars on the chart are updated, providing a clear overview of task status, project progress, potential risks, and bottlenecks.
Track progress…at a gantts!
Business Agility Meets Predictability
DevStride continuously innovates its Gantt charts, integrating dynamic and intuitive features that keep up with the fast pace of business while providing predictable results. Key capabilities include progress tracking, flexible views, and seamless integration with agile functionality. The result? Agility plus predictability - a more interconnected, intelligent project management approach that ensures project delivery speed and reliable outcomes.
-
Effective Project Management
A primary advantage of DevStride’s Gantt charts is the ability to visualize the sequence of project tasks, their dependencies, and the overall timeline. This feature helps project managers plan and coordinate tasks more effectively, ensuring that resources are allocated appropriately, and timelines are adhered to.
-
Adaptable Views
DevStride offers the right level of information at your fingertips for effective decision-making. Easily adjust details displayed in your chart by expanding or collapsing tasks as needed. This allows you to view the appropriate amount of detail for your specific needs, whether it's a high-level overview or a more detailed breakdown of tasks.
-
Flexible Modes
Gantt charts offer both a strict mode and free mode, giving you the flexibility to choose how downstream date dependencies are auto-synced. Customize Gantt chart behavior to align with your preferred project management style. Whether you need strict synchronization or more flexibility in handling dependencies, DevStride's can accommodate your unique preferences.
-
Risk Management
Gantt charts serve as an important tool for risk management. By showcasing the project timeline and dependencies, teams can identify potential risks and roadblocks early on. If a critical task gets delayed, it becomes immediately evident on the Gantt chart, allowing project managers to take corrective action before it impacts the overall schedule.


